Modelling effect of future land use on our health
Last year, we published a set of future scenarios for the Netherlands, focussing on issues relating to the health of people, animals and the environment, often collectively referred to as ‘One Health’. Now we have created future land use maps for each of these scenarios for 2050, enabling us to model future health risks.

We have already used these maps to predict the future abundances of different mosquito and bird species in other papers linked below this article. These predictions are currently being used to estimate the future risk of West Nile virus, Usutu virus and Rift Valley Fever virus outbreaks under the different scenarios.
Future land use affects our health
These scenarios were created as part of the One Health PACT project, which focuses on mosquito-borne disease risk in the Netherlands. However, our scenarios can be used to investigate a wide range of different future health risks, such as infectious diseases, pollution and flooding. Land use maps are a valuable tool for this.
Land use type (e.g. urban, forest, farmland, etc.) is known to influence health, for example it affects drinking water quality, populations of disease vectors (rats, mosquitoes, etc), air pollution and mental health. By estimating how land use might change in the future, we can get an idea of how severe different future health risks might be and we can plan accordingly.
Creating land use maps
To create these land use maps, we had to take into account many different considerations:
- How easy is it for land use to change and how long does it take (for example, turning a forest into a residential area is much easier and quicker than the other way round!)
- The future demand for different land use types
- The suitability of different locations for different land use types (for example, not putting urban areas in places with a high flood risk)
- Environmental protections on certain areas
This involved detailed analysis. For example, the future demand for different land types depends not only on the future population size, but also their priorities (e.g. how much they value nature), diets (if meat consumption is reduced then less space is needed for pasture) and technological progression (e.g. how much food can 1ha of farmland produce).
We also considered future changes in transport (airports, train stations and motorways), since this has consequences for urban and agricultural areas in terms of accessibility and ease of moving goods and produce.
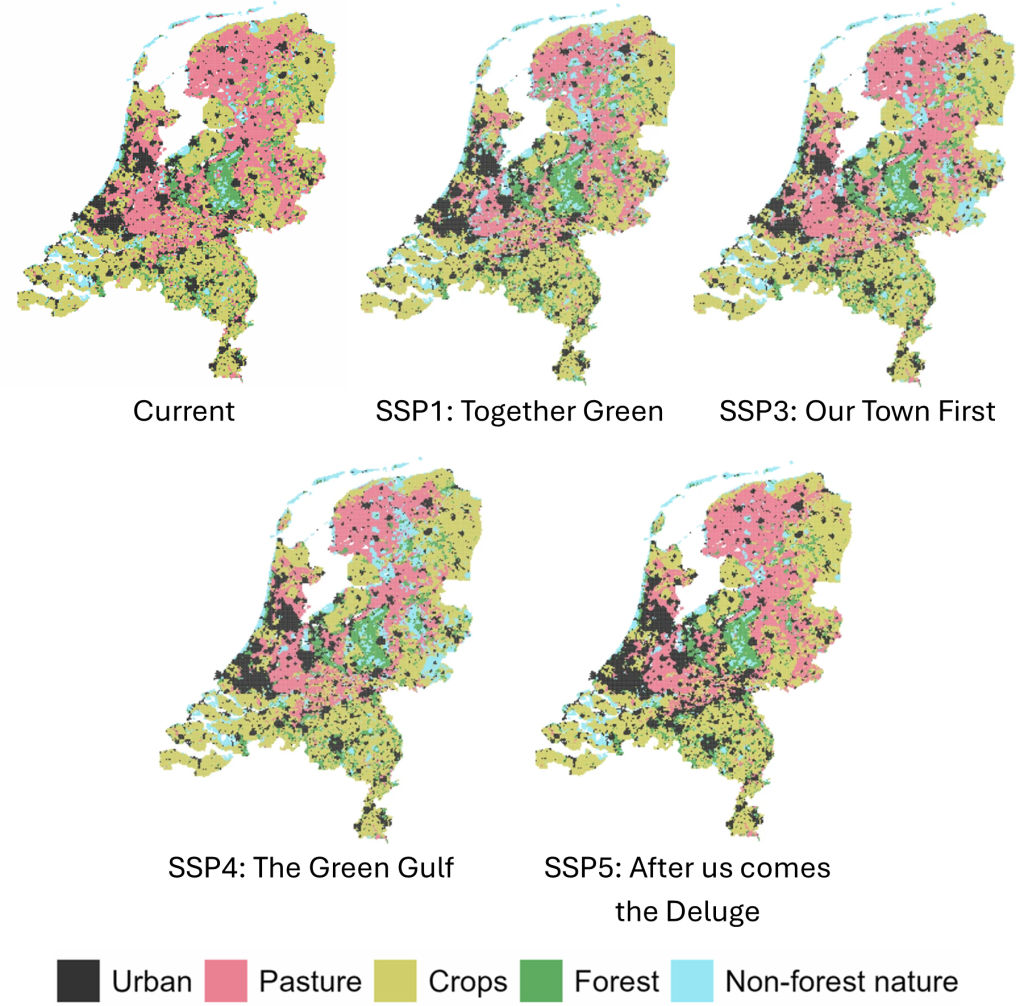
Land use maps for 2050
We produced 4 future land use maps for 2050, one for each scenario. Generally, urban and natural areas expanded, while agricultural areas were reduced. These link shows full details about the individual scenarios and the paper about the creation of the land use maps.
This work was performed in collaboration with Leiden University, Wageningen University and Research, and KNMI. The paper has been published with Nature Scientific Data.
More information
-
Combined effects of future climate and land use change on mosquitoes: The distribution of Culex pipiens under One Health scenarios in the Netherlands
-
Current and Future Probability of Occurrence of the Floodwater Mosquito Aedes vexans (Meigen, 1830) in the Netherlands
-
The future abundance of key bird species for pathogen transmission in the Netherlands